Configuration Guide
RegressionLab is highly customizable through a single .env file. This guide describes every option, where it applies (desktop, web, or both), and how to change it safely.
Getting Started with Configuration
Configuring from Tkinter (Desktop App)
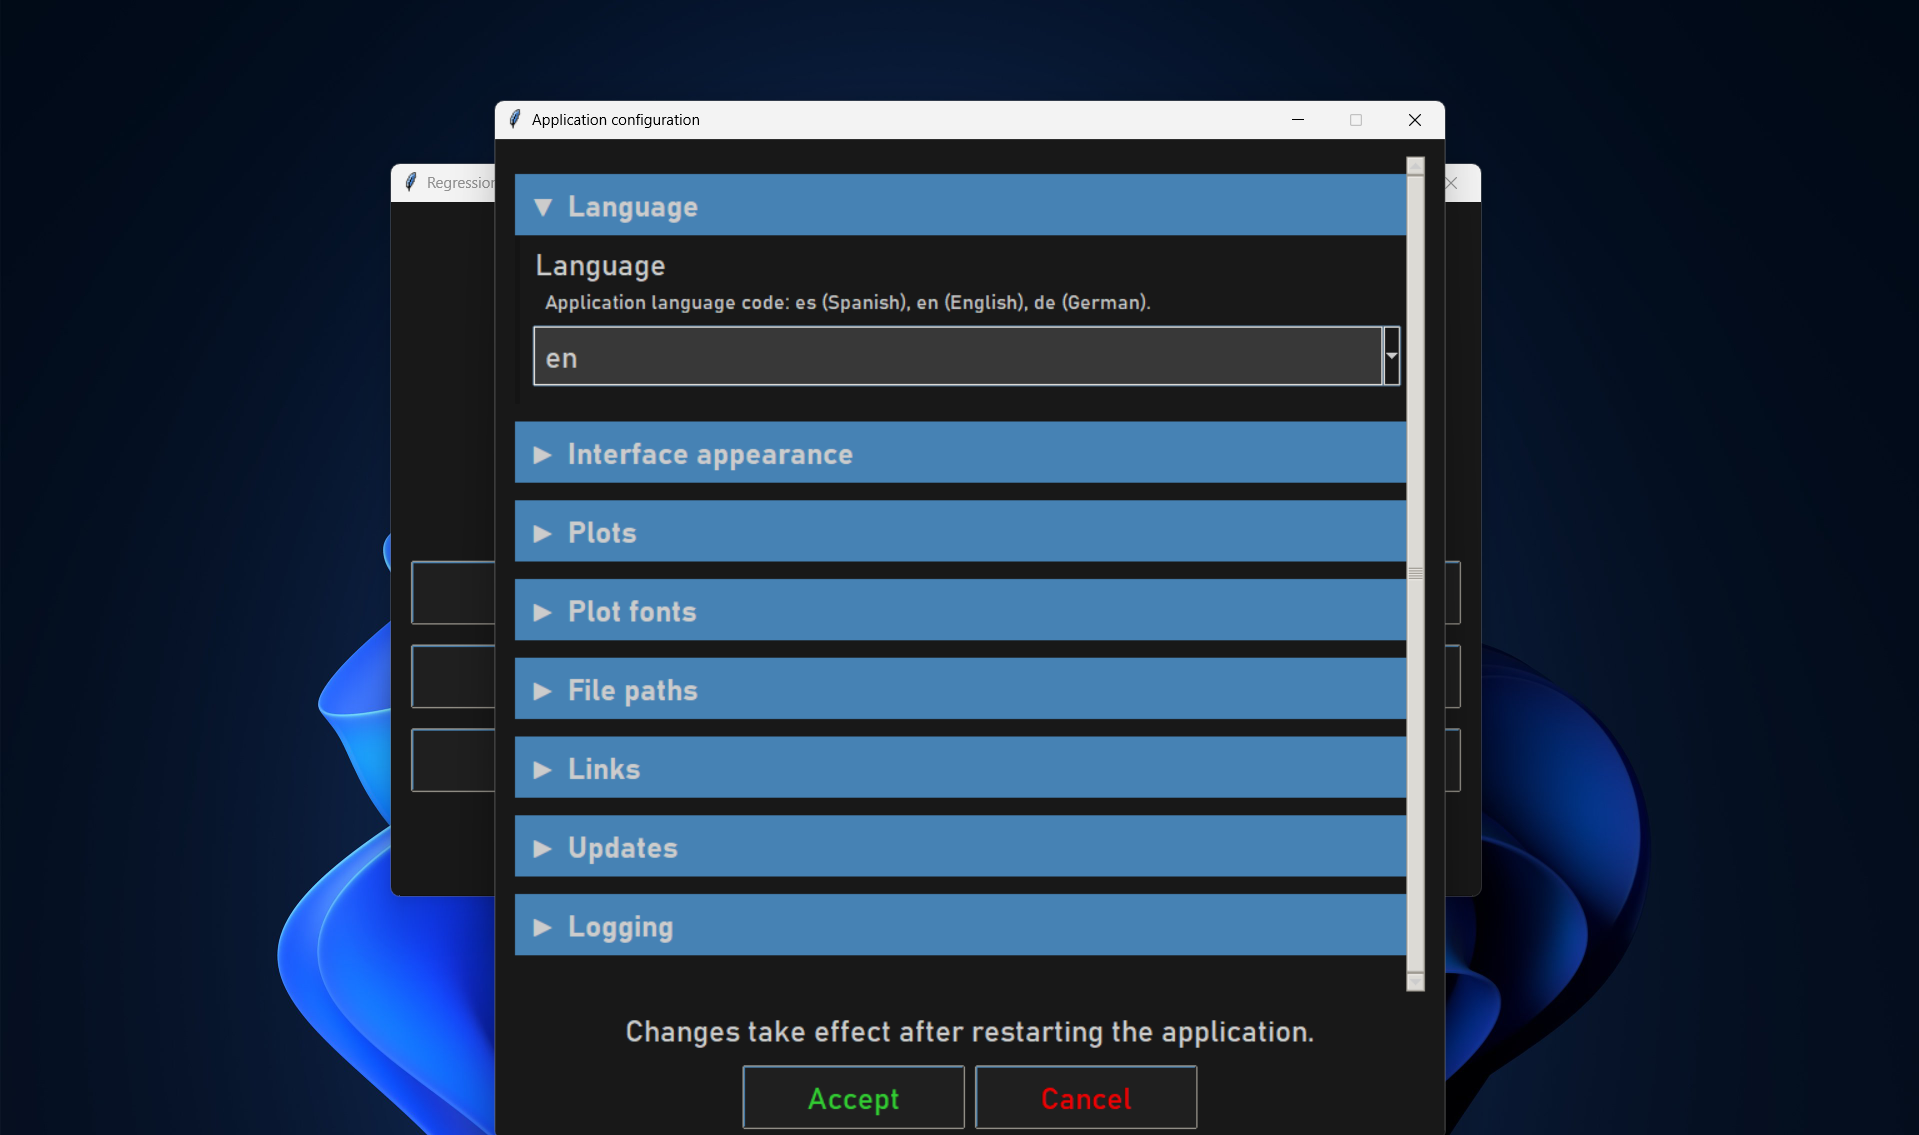
If you use the Tkinter desktop application, you can change settings without editing files: from the main menu, click Configure (or Configurar in Spanish). A configuration dialog opens with collapsible sections:
Language: Interface language (Spanish, English, German).
UI: Window and text colors, button colors (normal, cancel, accent), spacing, button width, font family and size, spinbox/entry widths, and data-preview selection color.
Plot: Figure dimensions, DPI, title visibility, grid display, and line/marker style and colors for generated plots.
Font: Font family and sizes for plot title, axis labels, and tick labels.
Paths: Default input and output folders, filename template for saved plots, and export format (PNG, JPG, PDF).
Links: Optional URL for the “Donations” link in the Information dialog.
Updates: Weekly update check (enable/disable), force check for testing, and URL to fetch the latest version.
Logging: Log level (e.g. DEBUG, INFO), log file path, and whether messages are also printed to the console.
Each option shows a short description. When you click Accept, the values are written to .env and the application restarts so the new settings take effect. Cancel discards changes. This is the easiest way to customize RegressionLab when using the desktop version.
Locating the Configuration File
The configuration file lives in the root directory of the RegressionLab project:
RegressionLab/
  .env               ← Your configuration file
  .env.example       ← Template with all options (desktop)
  .env_mobile.example ← Optional template for mobile (e.g. termux); copy to .env if needed
First-time setup
If .env does not exist yet:
# Copy the example file
cp .env.example .env

# Or on Windows
copy .env.example .env
Then open and edit .env with any text editor, for example:
Visual Studio Code:
code .env.Nano (Linux/macOS):
nano .env.Notepad (Windows):
notepad .env.Vim:
vim .env.
Configuration Sections
The .env file is grouped into sections that match the Tkinter Configure dialog:
1. Language Configuration
Setting the Application Language
LANGUAGE="es"
Available Languages:
es,español,spanish,esp→ Spanish (default)en,english,ingles,inglés,eng→ Englishde,german,deutsch,ger→ German
Example:
# Use Spanish (default)
LANGUAGE="es"

# Use English
LANGUAGE="en"

# Use German
LANGUAGE="de"
Effect:
Changes menus, buttons, dialogs, and all other interface text to the selected language.
Applies to both the Tkinter desktop app and the Streamlit web interface.
Does not change column names, file contents, or text you type (e.g. axis labels you enter yourself).
2. UI Theme Configuration
These settings control the look of the Tkinter desktop app (window, buttons, fonts, spacing). The Streamlit web interface uses them where applicable; behavior may differ. Hover and active (click) colors are derived automatically from the base colors you set.
Color Settings
Background and Foreground
UI_BACKGROUND="#181818"
UI_FOREGROUND="#CCCCCC"
UI_BACKGROUND: Background color of the main window and most panels.
UI_FOREGROUND: Default text color for labels, entries, and other UI text.
Color options:
Named colors:
"white","black","navy","crimson", etc.Hex codes:
"#2C3E50","#FF5733", etc.
Layout and Widget Sizes
Font Settings
UI_FONT_FAMILY="Bahnschrift"
UI_FONT_SIZE=18
UI_FONT_FAMILY: Font used for all UI text (menus, labels, buttons).
UI_FONT_SIZE: Base font size in points for the desktop interface.
Common font families:
Monospace:
"Courier","Courier New","Menlo","Monaco".Sans-serif:
"Arial","Helvetica","Verdana","Tahoma".Serif:
"Times New Roman","Georgia","Palatino".
Input Widget Sizes
UI_SPINBOX_WIDTH=10
UI_ENTRY_WIDTH=25
UI_SPINBOX_WIDTH: Width of numeric spinbox fields in character units.
UI_ENTRY_WIDTH: Width of text entry fields in character units.
Data Preview (Text Widget)
UI_TEXT_SELECT_BG="steel blue"
UI_TEXT_SELECT_BG: Background color of selected text in the data preview area. The preview uses UI_FOREGROUND for text; its background is derived from the main UI background.
Example Themes
Professional Dark Theme (default-like)
UI_BACKGROUND="#181818"
UI_FOREGROUND="#CCCCCC"
UI_BUTTON_BG="#1F1F1F"
UI_BUTTON_FG="lime green"
UI_BUTTON_FG_CANCEL="red2"
UI_BUTTON_FG_ACCENT2="yellow"
UI_PADDING=8
UI_BUTTON_WIDTH=12
Classic Light Theme
UI_BACKGROUND="white"
UI_FOREGROUND="black"
UI_BUTTON_BG="gray90"
UI_BUTTON_FG="blue"
UI_BUTTON_FG_CANCEL="red"
UI_BUTTON_FG_ACCENT2="dark orange"
UI_PADDING=8
UI_BUTTON_WIDTH=12
Ocean Theme
UI_BACKGROUND="#001f3f"
UI_FOREGROUND="#7FDBFF"
UI_BUTTON_BG="#003366"
UI_BUTTON_FG="#39CCCC"
UI_BUTTON_FG_CANCEL="#FF851B"
UI_BUTTON_FG_ACCENT2="#7FDBFF"
UI_PADDING=8
UI_BUTTON_WIDTH=12
3. Plot Style Configuration
These settings control the size, resolution, and visual style of the regression plots (used by both the Tkinter and Streamlit interfaces).
Figure Dimensions
PLOT_FIGSIZE_WIDTH=12
PLOT_FIGSIZE_HEIGHT=6
DPI=100
PLOT_FIGSIZE_WIDTH: Figure width in inches (for both on-screen display and saved files).
PLOT_FIGSIZE_HEIGHT: Figure height in inches.
DPI: Resolution in dots per inch; higher values give sharper output and larger file sizes.
Recommendations:
Screen display: 100 DPI.
High-quality prints: 300 DPI.
Publications: 600 DPI.
Title Display
PLOT_SHOW_TITLE=false
PLOT_SHOW_TITLE: Whether to display a title above the plot.
true: Show title (derived from the plot name).false: No title (cleaner look for slides or publications).
In the Streamlit app, a checkbox before each fit overrides this value per fit; the default is loaded from this env var.
Grid Display
PLOT_SHOW_GRID=false
PLOT_SHOW_GRID: Whether to display a background grid on the plot.
true: Show grid lines (helps read values from the plot).false: No grid (default; cleaner look for slides or publications).
Fitted Curve Style
PLOT_LINE_COLOR="black"
PLOT_LINE_WIDTH=1.0
PLOT_LINE_STYLE="-"
PLOT_LINE_COLOR: Color of the fitted regression curve.
PLOT_LINE_WIDTH: Line width in points (e.g. 1.0 = thin, 2.0 = bold).
PLOT_LINE_STYLE: Line pattern for the fitted curve.
Line style options:
"-": Solid line (default)."--": Dashed line."-.": Dash-dot line.":": Dotted line.
Data Points Style
PLOT_MARKER_FORMAT="o"
PLOT_MARKER_SIZE=5
PLOT_MARKER_FORMAT: Marker shape for the measured data points.
PLOT_MARKER_SIZE: Marker size in points.
Marker format options: "o" (circle, default), "s" (square), "^" (triangle up), "d" (diamond), "*" (star).
Colors for Data Points
PLOT_ERROR_COLOR="crimson"
PLOT_MARKER_FACE_COLOR="crimson"
PLOT_MARKER_EDGE_COLOR="crimson"
PLOT_ERROR_COLOR: Color of the vertical (or horizontal) error bars on data points.
PLOT_MARKER_FACE_COLOR: Fill color of the data point markers.
PLOT_MARKER_EDGE_COLOR: Outline/border color of the markers.
Common color names:
Basic:
"red","blue","green","black","white".Extended:
"crimson","navy","teal","gold","orange".Scientific:
"darkblue","darkgreen","darkred".
Example Plot Styles
Publication Style (Black & White)
PLOT_LINE_COLOR="black"
PLOT_LINE_WIDTH=2.0
PLOT_LINE_STYLE="-"
PLOT_MARKER_FORMAT="o"
PLOT_MARKER_SIZE=6
PLOT_ERROR_COLOR="black"
PLOT_MARKER_FACE_COLOR="white"
PLOT_MARKER_EDGE_COLOR="black"
DPI=300
Colorful Presentation Style
PLOT_LINE_COLOR="#2C3E50"
PLOT_LINE_WIDTH=2.5
PLOT_LINE_STYLE="-"
PLOT_MARKER_FORMAT="^"
PLOT_MARKER_SIZE=8
PLOT_ERROR_COLOR="#E74C3C"
PLOT_MARKER_FACE_COLOR="#E74C3C"
PLOT_MARKER_EDGE_COLOR="#C0392B"
DPI=150
4. Font Configuration
Control the font family, size, and style of all text drawn on the plots (title, axis labels, and tick numbers).
Font Family
FONT_FAMILY="serif"
Options (Matplotlib generic families; exact font depends on your system):
serif: Serif fonts (e.g. Times-like); good for formal or printed work.sans-serif: Sans-serif fonts (e.g. Arial-like); clean and readable on screen.monospace: Fixed-width fonts (e.g. Courier-like); useful for technical labels.cursive: Script-like fonts; decorative use.fantasy: Decorative/artistic fonts.
Title Font
FONT_TITLE_SIZE="xx-large"
FONT_TITLE_WEIGHT="semibold"
FONT_TITLE_SIZE: Relative size of the plot title. Only used when PLOT_SHOW_TITLE is
true.
Size options: xx-small, x-small, small, medium, large, x-large, xx-large.
FONT_TITLE_WEIGHT: Font weight (boldness) of the plot title.
Weight options: normal, light, semibold, bold, heavy.
Axis Labels
FONT_AXIS_SIZE=30
FONT_AXIS_STYLE="italic"
FONT_AXIS_SIZE: Font size in points for the x- and y-axis labels.
FONT_AXIS_STYLE: Font style for axis labels (e.g. variable names are often italic).
Style options: normal, italic, oblique.
Tick Labels
FONT_TICK_SIZE=16
FONT_TICK_SIZE: Font size in points for the numbers on the axis tick marks.
Example Font Configurations
Academic Publication
FONT_FAMILY="serif"
FONT_TITLE_SIZE="large"
FONT_TITLE_WEIGHT="bold"
FONT_AXIS_SIZE=24
FONT_AXIS_STYLE="italic"
FONT_TICK_SIZE=18
Modern Presentation
FONT_FAMILY="sans-serif"
FONT_TITLE_SIZE="x-large"
FONT_TITLE_WEIGHT="semibold"
FONT_AXIS_SIZE=28
FONT_AXIS_STYLE="normal"
FONT_TICK_SIZE=20
5. File Path Configuration
Control the default folders for loading data and saving plots, the naming pattern for saved files, and the image format used when exporting.
FILE_INPUT_DIR="input"
FILE_OUTPUT_DIR="output"
FILE_FILENAME_TEMPLATE="fit_{}"
FILE_PLOT_FORMAT="png"
Input Directory
FILE_INPUT_DIR="input"
Options:
Relative path (from the RegressionLab root): e.g.
"input","data","experiments".Absolute path: e.g.
"/home/user/data"or"C:\\Users\\Name\\Documents\\Data".
Output Directory
FILE_OUTPUT_DIR="output"
Options:
Relative path: e.g.
"output","results","plots"(from the RegressionLab root).Absolute path: e.g.
"/home/user/results"or"C:\\Users\\Name\\Documents\\Results".
Note: The output directory is created automatically if it does not exist.
Filename Template
FILE_FILENAME_TEMPLATE="fit_{}"
The {} placeholder is replaced with the plot name (e.g. from the loaded file or dialog). The file extension is added automatically based on FILE_PLOT_FORMAT (e.g. .png).
Examples:
# Default (output: fit_experiment1.png when FILE_PLOT_FORMAT="png")
FILE_FILENAME_TEMPLATE="fit_{}"

# With prefix
FILE_FILENAME_TEMPLATE="regression_{}"
# Result: regression_experiment1.png

# With suffix
FILE_FILENAME_TEMPLATE="{}_result"
# Result: experiment1_result.png
Plot Output Format
FILE_PLOT_FORMAT="png"
Options: png, jpg, pdf
png: Default; good balance of quality and file size; supports transparency.
jpg: Smaller files; suitable for sharing or embedding when vector output is not required.
pdf: Vector output for publications and printing; in-app preview may still be raster (e.g. PNG).
6. Links (Optional)
DONATIONS_URL="https://www.youtube.com/@whenphysics"
DONATIONS_URL: URL displayed as a “Donations” (or similar) link in the desktop app’s Information / help dialog, e.g. to support the project. Leave empty to hide the link.
7. Update Check (Tkinter)
The Tkinter desktop app can check for updates once a week when you open it. If a newer version is available, a dialog asks whether you want to update. If you confirm, the app runs git pull --ff-only to update the code without creating automatic merge commits. Your input/, output/ folders and .env file are not modified.
CHECK_UPDATES=true
CHECK_UPDATES_FORCE=false
UPDATE_CHECK_URL="https://raw.githubusercontent.com/DOKOS-TAYOS/RegressionLab/main/pyproject.toml"
Enable or Disable Update Check
CHECK_UPDATES=true
true: Check for updates weekly when opening the app (default).false: Disable the update check entirely; no dialog will appear.
Force Check (for Testing)
CHECK_UPDATES_FORCE=false
true: Always run the update check when opening the app, ignoring the 7-day interval. Useful for testing.false: Use the normal weekly interval (default).
Version Check URL
UPDATE_CHECK_URL="https://raw.githubusercontent.com/DOKOS-TAYOS/RegressionLab/main/pyproject.toml"
URL of the remote
pyproject.tomlused to fetch the latest version. Leave empty to use the default (RegressionLab main branch).If you use a fork, set this to your fork’s URL.
How It Works
The app stores the last check timestamp in
.last_update_check(project root). The file is empty; only its modification time is used.If at least 7 days have passed (or
CHECK_UPDATES_FORCE=true), the app fetches the remote version and compares it with the current one.If a newer version exists, a dialog asks whether to update. If you confirm,
git pull --ff-onlyis run. User data ininput/,output/, and.envis preserved.
8. Logging Configuration
Control where and how much RegressionLab logs: level of detail, log file location, and whether messages are also printed to the console.
LOG_LEVEL=INFO
LOG_FILE=regressionlab.log
LOG_CONSOLE=false
Log Level
LOG_LEVEL=INFO
Options (from most to least verbose):
DEBUG: Very detailed messages (function flow, variable values); useful for development and debugging.INFO: General operational messages (default); good for normal use.WARNING: Only warnings and more severe; reduces log noise.ERROR: Only errors and critical issues.CRITICAL: Only critical failures.
Recommendation: Use INFO for everyday use; switch to DEBUG when troubleshooting.
Log File
LOG_FILE=regressionlab.log
Path to the log file (relative to the RegressionLab root or absolute). Logs are appended; the file is created automatically if it does not exist.
Examples:
# Default (in RegressionLab root)
LOG_FILE=regressionlab.log

# In logs subdirectory
LOG_FILE=logs/app.log

# Absolute path
LOG_FILE=/var/log/regressionlab.log
Console Logging
LOG_CONSOLE=false
true: Also print log messages to the console/terminal (useful when running from a terminal).false: Write only to the log file (default; cleaner when using the GUI).
Recommendation: Use true when debugging from the command line; use false when running the desktop app or for quieter operation.
Applying Configuration Changes
Tkinter (desktop)
You can change settings in two ways:
From the app: Main menu → Configure (or Configurar). Adjust values in the dialog and click Accept; the app restarts so the new settings take effect.
By editing
.env: Edit.envwith a text editor, save, then restart the application:
# Restart the application
python src/main_program.py
Streamlit (web)
Edit the
.envfile and save.Reload the app in your browser (e.g. Ctrl+R or Cmd+R).
Note: For some changes (e.g. paths or logging), you may need to stop and restart the Streamlit server:
# Stop: Ctrl+C in terminal
# Restart:
streamlit run src/streamlit_app/app.py
Common Configuration Scenarios
Scenario 1: Preparing plots for publication
# High-resolution black-and-white plots for papers or reports
DPI=600
PLOT_LINE_COLOR="black"
PLOT_LINE_WIDTH=2.0
PLOT_MARKER_FORMAT="o"
PLOT_MARKER_SIZE=6
PLOT_ERROR_COLOR="black"
PLOT_MARKER_FACE_COLOR="white"
PLOT_MARKER_EDGE_COLOR="black"
PLOT_SHOW_TITLE=false
FONT_FAMILY="serif"
FONT_AXIS_SIZE=28
FONT_TICK_SIZE=20
Scenario 2: Quick data exploration
# Fast rendering and colorful on-screen display
DPI=100
PLOT_LINE_COLOR="blue"
PLOT_LINE_WIDTH=1.5
PLOT_MARKER_FORMAT="o"
PLOT_MARKER_SIZE=5
PLOT_ERROR_COLOR="red"
PLOT_MARKER_FACE_COLOR="red"
PLOT_MARKER_EDGE_COLOR="red"
PLOT_SHOW_TITLE=true
LOG_LEVEL=WARNING
Scenario 3: Debugging issues
# Detailed logging to trace problems
LOG_LEVEL=DEBUG
LOG_CONSOLE=true
LOG_FILE=debug.log
Set LOG_CONSOLE to true so you can see logs in the terminal.
Scenario 4: Batch processing
# Settings suited to processing many files in one run
DPI=150
FILE_OUTPUT_DIR="batch_results"
LOG_LEVEL=WARNING
LOG_CONSOLE=false
Troubleshooting configuration
Changes not applied
Problem: You edited .env but the app still shows old behavior.
Solutions:
Confirm the
.envfile was saved (check the timestamp).Fully quit and restart the application (not just refresh the window).
Look for syntax errors: missing quotes, stray spaces, or broken lines in
.env.Ensure
.envis in the RegressionLab project root (same folder assrc/,.env.example, etc.).
Invalid color names
Problem: The app reports an invalid or unknown color.
Solutions:
Put color values in double quotes:
"midnight blue"notmidnight blue.Use a standard color name (e.g. from Matplotlib) or a hex code like
"#2C3E50".Check spelling; multi-word names must be quoted.
Font not found
Problem: The UI or plot does not show the font you configured.
Solutions:
Confirm the font is installed on your system (e.g. via Font Book, Windows Fonts).
Prefer generic families (
serif,sans-serif,monospace); the system will pick a suitable font.Check the exact font name (e.g. “Times New Roman” vs “Times”).
Path issues
Problem: The app cannot find the input or output directory (or files in it).
Solutions:
On Windows, use forward slashes (
/) or escaped backslashes (\\) in paths.For FILE_INPUT_DIR, the folder must exist; for FILE_OUTPUT_DIR, it is created if missing.
Check read/write permissions for the chosen directories.
If relative paths fail, try an absolute path to rule out working-directory issues.
Default configuration
To restore default settings, overwrite .env with the example file:
cp .env.example .env
Or delete .env and let RegressionLab use built-in defaults.
Next steps
Customize your plots: Experiment with plot styles and fonts.
Create a theme: Build a UI theme that fits your workflow.
Go further: See the Extending RegressionLab guide for advanced customization.
Need more help? Check the Troubleshooting Guide or open an issue on GitHub.